Yesterday I published a post that attempted to model tornado counts in a manner that would allow insights into just how rare the current "tornado drought" and recent "tornado surplus" actually are. There are numerous limitations to these simple models, but two that really stand out are:
- 2010, 2011, and 2012 all contribute tornado counts to either the record minimum or record maximum tornado counts.
- The simple models used only generate "years" that begin with January and run through December. This excludes the possibility for the inter-year 12-month counts, such as what comprises the current record minimum and maximum.
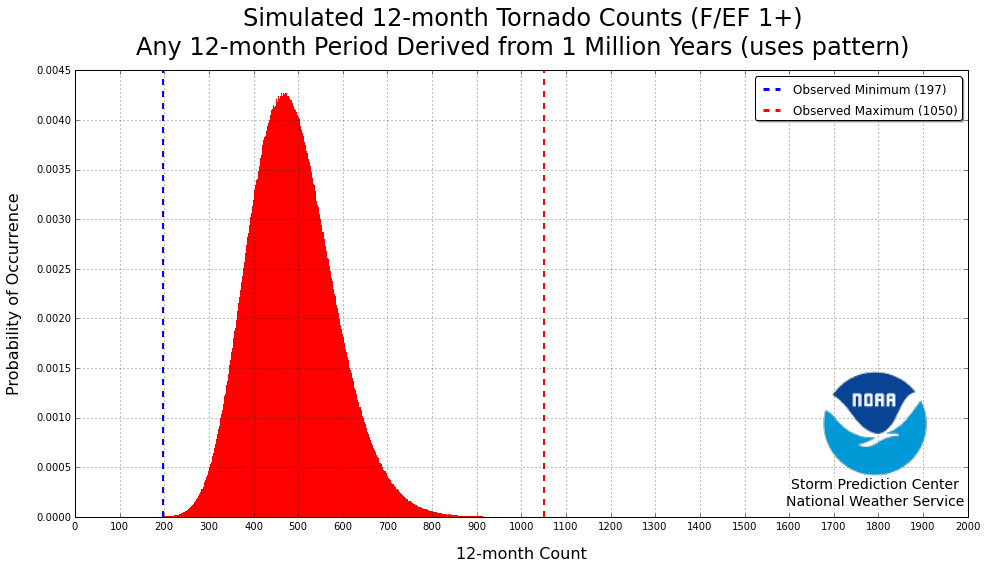
In an attempt to address the first bullet, I have removed the years 2010, 2011, and 2012 from the input data. In an attempt to address the second bullet, I created 12-month running totals from the 1 million years. Thus, the modeled distribution includes 12-month periods of January through December; April through March (of the following year); November through October (of the following year); etc.
Removing 2010, 2011, and 2012 --- in particular 2011 --- the right-tail of the distribution is significantly altered. The maximum 12-month tornado counts are actually fewer than they were in the previous models. This was expected as 2011 was such an anomalous year in terms of the number of tornadoes (as the residents of the Southeast can attest to). The thought is that by removing the influence of 2011 the modeled distribution would more closely resemble "truth".
The new distribution is shown below.
In the new model, the minimum number of 12-month tornadoes was 160, with 1143 the maximum. The maximum number of tornadoes from this new model is quite a few less than the even simpler models previously used. This results in a significant change in the rarity of the 2010-2011 record 12-month maximum. As is shown below, it is actually substantially more rare of an event than the current tornado drought.
- Simulated Minimum (160) (Probability: ~0
- Observed Minimum (197) Probability: 0.0000223333538056
- Observed Maximum (1050) Probability: 0.999998666665 (0.0000013333)
- Simulated Maximum (1143) Probability: ~1.0 (~0)
- Return Period for Observed Minimum: 44776.0783582 months (3731.33986318 years).
- Return Period for Observed Maximum: 749999.313258 months (62499.9427715 years).
By removing the influence of 2011, the return period for the maximum record (1050 tornadoes) between June 2010 and May 2011 is 749,999 months, or 62,500 years. By removing the influence of 2012, the return period for the minimum record (197) tornadoes between May 2012 and April 2013 is 44,776 months, or 3731 years. Thus, when removing the years contributing to the most and fewest tornado counts, the rarity is almost opposite as to what the previous, simpler models found.
Lastly, just a reminder that even though these models are somewhat complex in (some of) their logic, they are relatively simple models in the grand scheme of things. Anytime one tries to understand/predict things about extreme events the slightest changes to the underlying assumptions can have a profound impact in the results, as is illustrated by the switching of the rarity between this model and those used yesterday.
