Last July I wrote about software I was developing for displaying forecast soundings. Unfortunately, after discussing what I already had done in preparation for last year’s Hazardous Weather Testbed (HWT) Experimental Forecast Program (EFP), my schedule prevented me from devoting any time toward this project.
In the days before Christmas I realized that I needed to revisit SHARPpy (SkewT and Hodograph Analysis and Research Program in Python) if I was going to have anything for my presentation at the American Meteorological Society’s Annual Meeting in New Orleans, LA. So, the last two weeks has been devoted to frantic code writing to put together some form of SHARPpy in time for my presentation. When I sat down and looked at my old work, I couldn’t understand, nor could I remember, what I had been doing. I decided to throw out my old work and begin anew.
SHARPpy has been completely overhauled. The visual aesthetics are modeled after the Storm Prediction Center’s sounding analysis tool, NSHARP, and the underlying numerical routines are based on SHARP95. SHARPpy is written completely in pure Python — no Numpy, Scipy, or Matplotlib. In other words, once Python is installed on a computer, you can install and run SHARPpy — there are absolutely no additional dependencies to install! The motivation for sticking with pure Python, and sacrificing the speed Numpy, Scipy, and Matplotlib offer, was to allow for simple integration into the National Weather Service’s data visualization software package (Advanced Weather Information Processing System II — AWIPSII), which is currently under development. (Note, SHARPpy 2.0 will most likely be refactored to make use of Numpy, Scipy, and Matplotlib.)
SHARPpy is written in such a manner that the file handing and data management, graphical displays, and numerics are all separate. This greatly increases SHARPpy’s utility. Inside SHARPpy, all calculations are done on a custom data structure, called a Profile Object. The Profile Object consists of 6 data arrays: Pressure, Height, Temperature, Dewpoint, U-component of wind, and V-component of the wind, as well as some meta-data and helper functions to identify things such as the index of the surface layer. (Alternatively, one could provide the Wind Direction in degrees and Wind Speed and the Profile Object will convert these to the U-, V-components on the fly.) The benefit of using the Profile Object is that SHARPpy knows the structure of the data on which it will operate and/or draw. Thus, in order to add support for additional data types (observational, BUFKIT format, raw models, etc) all one has to do is create a wrapper to put the data into the Profile Object. (The Profile Object has helper functions to create itself. All one does is pass the 6 arrays!) Also, since the drawing is separate from the numerics, SHARPpy can be used to compute thermodynamic and kinematic parameters for model output — without having to actually draw individual soundings!
Below are a smattering of sample images created this evening.
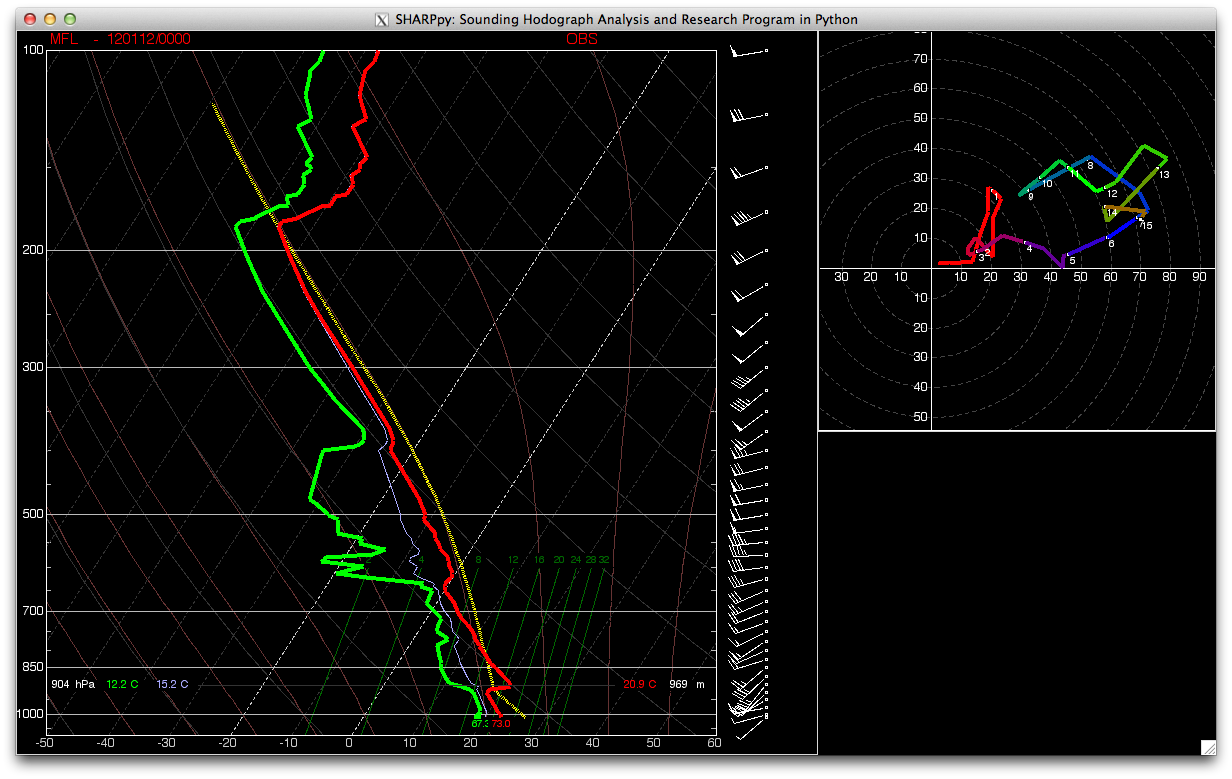
The first image is tonight’s sounding from Miami, FL. The temperature trace is in red, the dewpoint trace is in green. The blue trace corresponds to the wet-bulb temperature. The yellow-traces (there are more than one, they just overlap!) are the parcel trajectories for a Surface-Based Parcel, 100-hPa Mixed Layer Parcel, and the Effective-Inflow-Layer Mixed Parcel. In the upper-right, the hodograph is displayed with white dots indicating each 1km AGL interval. (Note, the program goes out to the web and downloads the data, lifts all the parcels, and draws the display in about 1-1.5 seconds!)
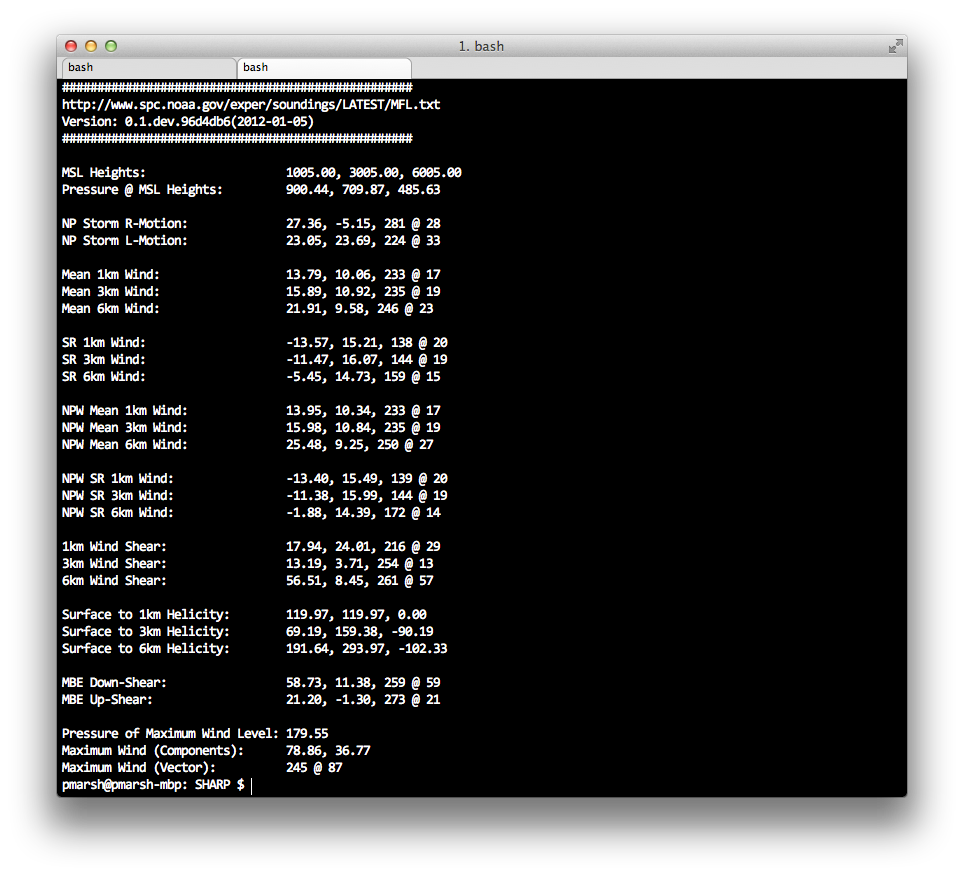
In addition to computing the visual SkewT and Hodograph, SHARPpy can compute kinematic variables and parameters. Below are just a sample of the fields that can be computed. Wind information is displayed in a format of U-, V-component, Wind Direction @ Wind Speed. Helicity information is provided positive+negative helicity, positive helicity, and negative-helicity. Again, this takes less than 0.5 seconds to compute and display. (These are for the Miami, FL sounding displayed above.)
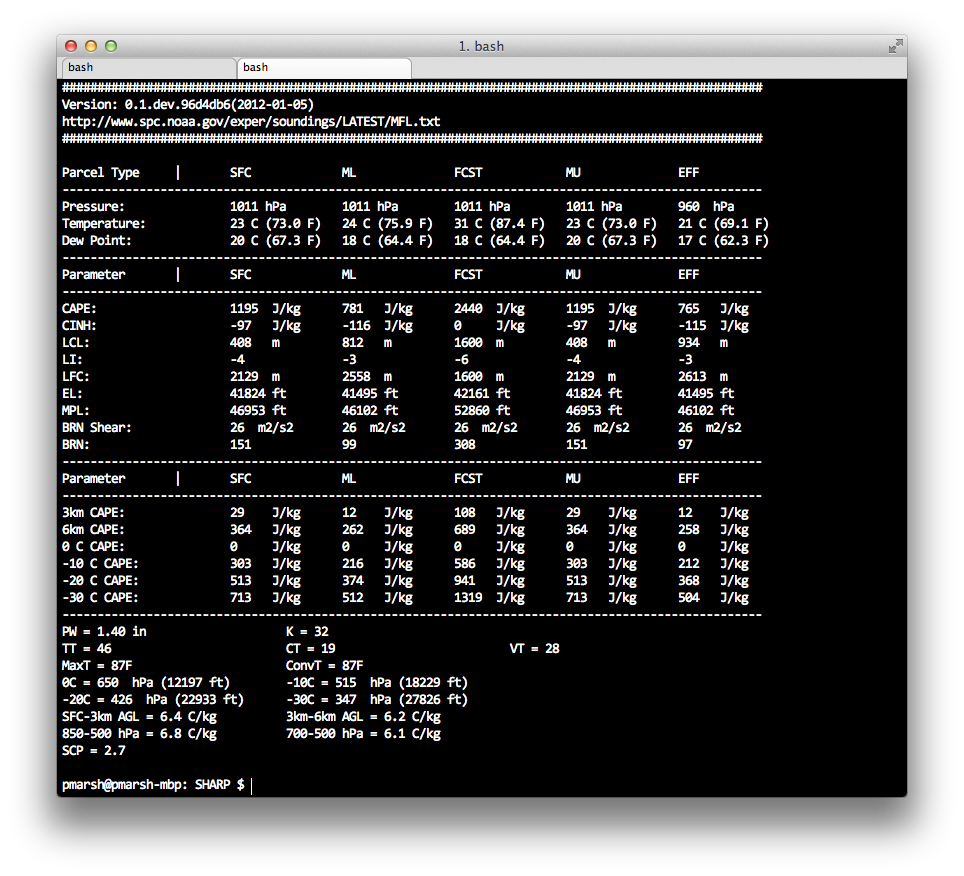
Below is a small sample of the thermodynamic variables and parameters that can be computed. All five parcels (Surface, Mixed-Layer, Most-Unstable, Forecast Surface, and Effective Inflow Layer) are computed. This routine takes about 0.5 seconds to run. (These are for the Miami, FL sounding displayed above.)
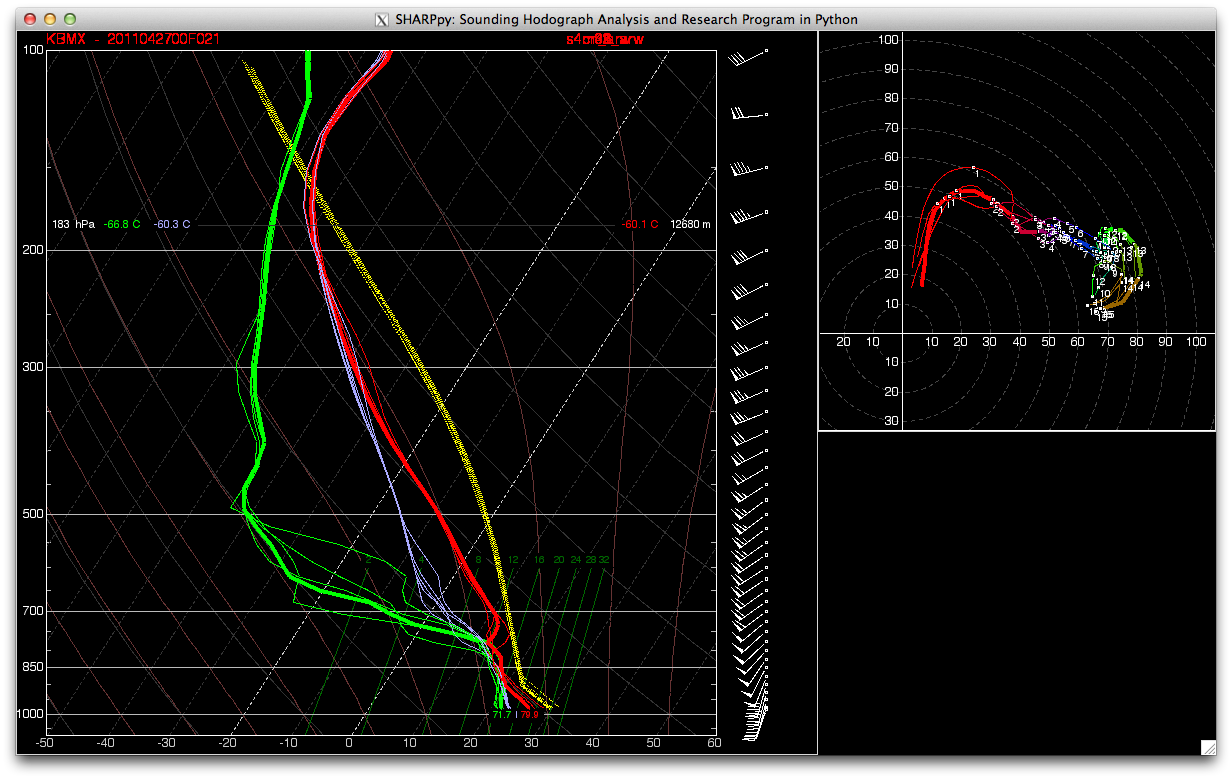
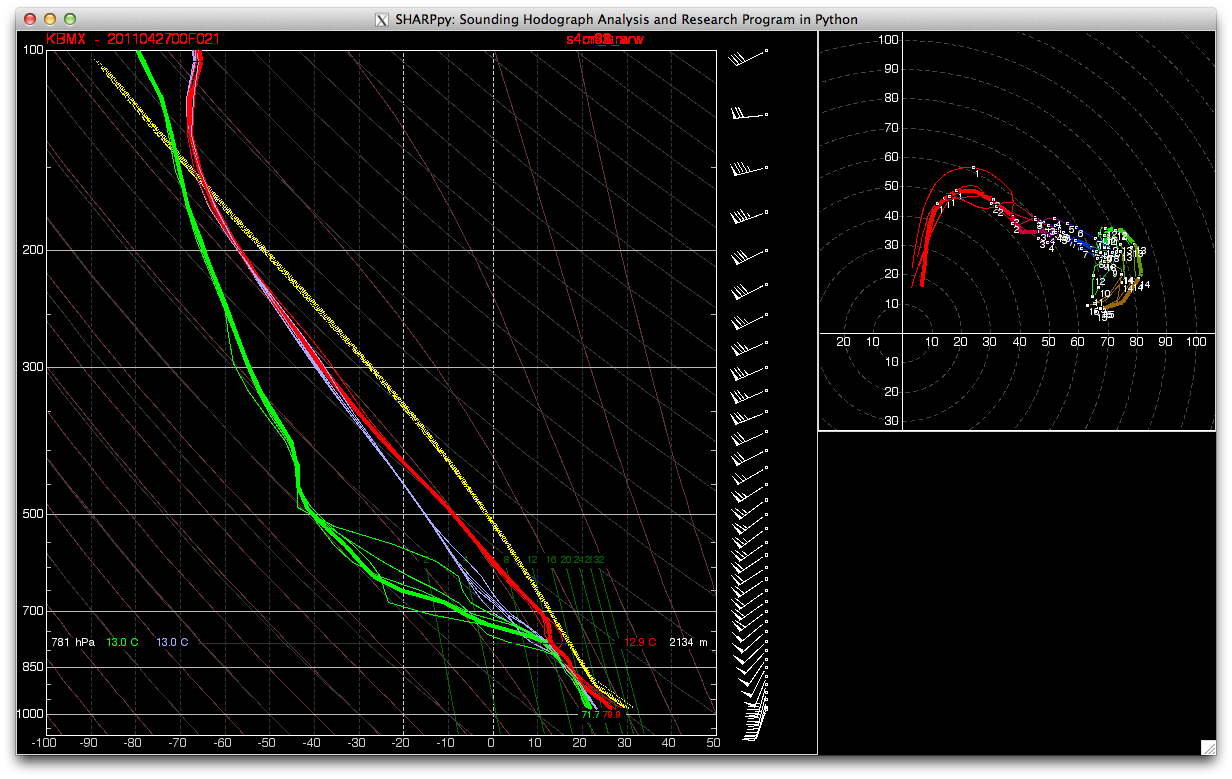
Lastly, I’ve incorporated preliminary support for ensemble soundings. Below are five, 4-km storm-scale ensemble member forecasts for Birmingham, Alabama. These model simulations were created in support of last year’s HWT EFP. They were initialized at 00 UTC 27 April 2011 and are valid for 21 UTC 27 April 2011. Each forecast member has over 1100 sounding locations, with 37 forecast soundings at each location. These data are stored in a text file that is approximately 150MB per member! SHARPpy can read these text files, parse out the correct soundings, compute all the parameters, and draw the sounding in less than 5 seconds!
What is displayed are the temperature, dewpoint, wet-bulb temperature, and hodograph for each of the 5 members. The thicker lines are from the “control member” and the other lines are from various perturbations. I should also point at that the wind barbs plotted on the right of the skewt are from the control member, as well.
I still have a lot of work left ahead of me (such as fixing up some of the displays and incorporating the text output on the main graphical display), but SHARPpy is coming along nicely. If you will be attending the AMS Annual Meeting later this month, please be sure to stop by my talk! It’s in the Python Symposium and will take place Tuesday morning at 11:15 AM. After my presentation, I hope to release SHARPpy to the open-source community. This will give people the ability to download and test SHARPpy while it is still under development, provide feedback, and even help develop new features! Some features that I’m interested in including are time-height cross-sections, more winter weather support, and whatever else might come to mind! It is my hope that SHARPpy can become a community supported sounding analysis package that the meteorological community can coalesce around!
And, for my international friends, if you aren’t fond of SkewTs, SHARPpy can also make STUVEs!
Please let me know what you think!
