By the afternoon of 28 April 2011 it was fully apparent that the unthinkable had happened. In an era of unprecedented communication abilities, a single tornado outbreak took the lives of more people than all the tornadoes over the past several years combined – in broad daylight no less. In the days the followed, many tried to place this event into historical context. Nearly every one defaulted to the 3-4 April 1974 “Super Outbreak”.
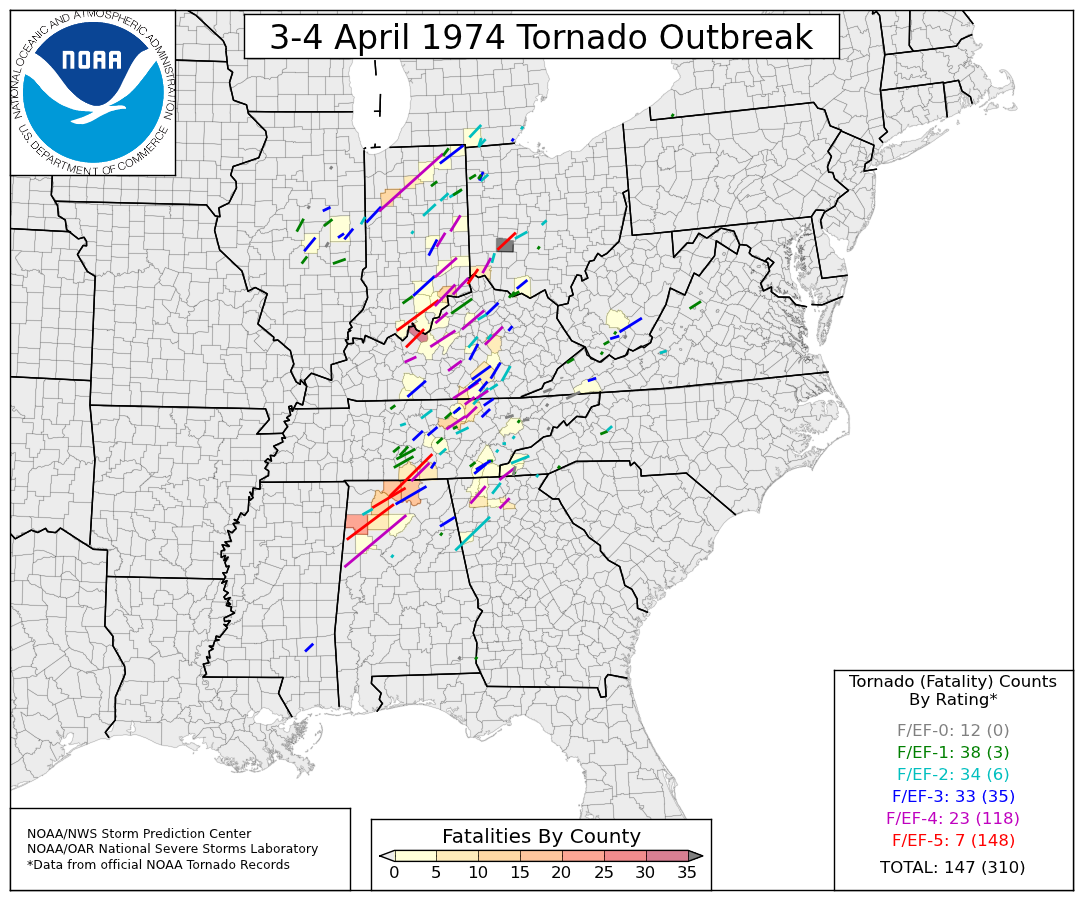
The Super Outbreak was nothing short of impressive from a meteorological point of view. 148 tornadoes, 319 fatalities, over 13-states, in 24-hours. Never before, and not until this April, had anything even close to the scale of this tornado outbreak had ever been recorded. By comparison, the tornado outbreak of 27-28 April 2011 has an unofficial count (undertaken by several of us at the Storm Prediction Center) of over 174 tornadoes (done via Public Information Statements) and 259 fatalities attributed to these tornadoes. (Unfortunately, the death toll is considerably higher, I simply have been unable to place all the fatalities to the corresponding tornado at this time.)
From the standpoint of the number of tornadoes recorded and the number of fatalities, these two tornado outbreaks are in a class by themselves (in the “modern” tornado database starting in 1950). In the days that followed, I created a set of figures for internal NWS/SPC/NSSL use to compare the two tornado outbreaks. The images show all reported tornado tracks, color coded based on intensity and the counties are color-filled based on the number of fatalities that occurred within that county’s boundaries. A simple, quick look through the two events shows that the 3-4 April 1974 event covered a much larger area than the 27-28 April 2011 event, although there is considerable overlap between the two events. Several counties experienced fatalities in both events; in fact, Marion County, Alabama was unfortunate to have had a F/EF-5 tornado, and large loss of life, in both of outbreaks (1974: Guin, AL; 2011: Hackleburg, AL). Lastly, each figure has a table of the number of tornadoes and corresponding fatalities, broken down by EF-Scale (the 2011 event is still “preliminary” and subject to change). (Note, higher resolution images, for “zooming” are available by request.)
Meteorologists (and others) can, and will, debate for years as to which event was “more impressive”. I know what my thoughts are, but I’ll spare you those. However, please feel free to leave your thoughts in the comments.
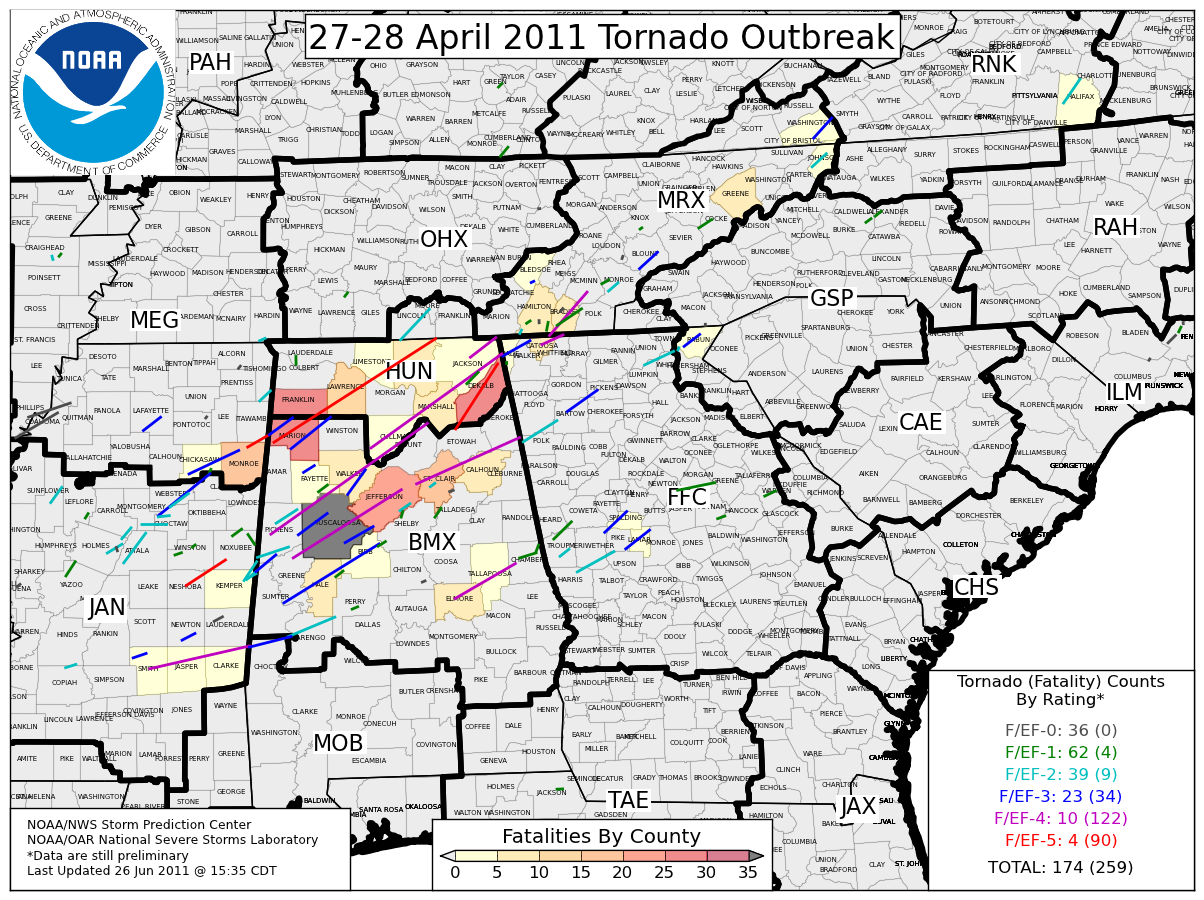
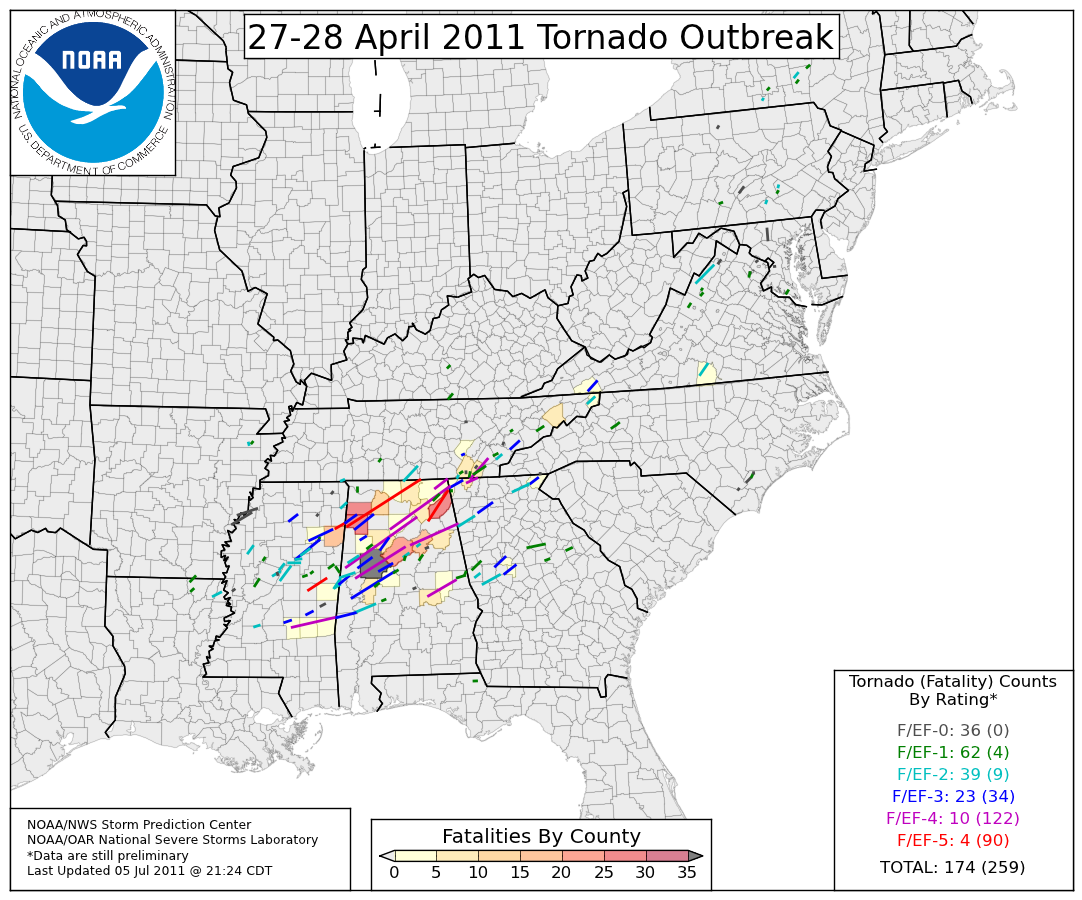 The two images above are on the same background. This means if you download both of them and flip back and forth between the two, the only things that should change are the county colors and tornado tracks. Below is a zoomed in version of the 27-28 April 2011 event, complete with NWS County Warning Areas and County Names denoted.