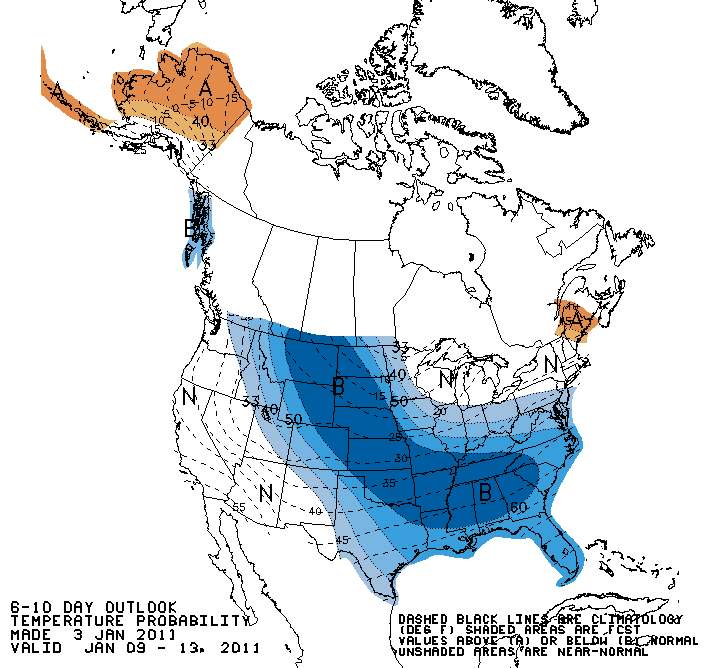
In meteorology we tend to deal in extremes and anomalies. After all, this is what causes the biggest impact on society. Days in which the temperature and precipitation are average, or nearly average don’t result in significant impacts to travel, construction, etc. It’s the extreme or anomalous events that get people’s attention and negatively impact society. With this said, consider the current forecast for the upcoming weekend into much of next week. Below is the Climate Prediction Center’s (CPC) 6-10 Day Temperature Outlook. Notice how the entire contiguous United States is expected to have below normal temperatures!
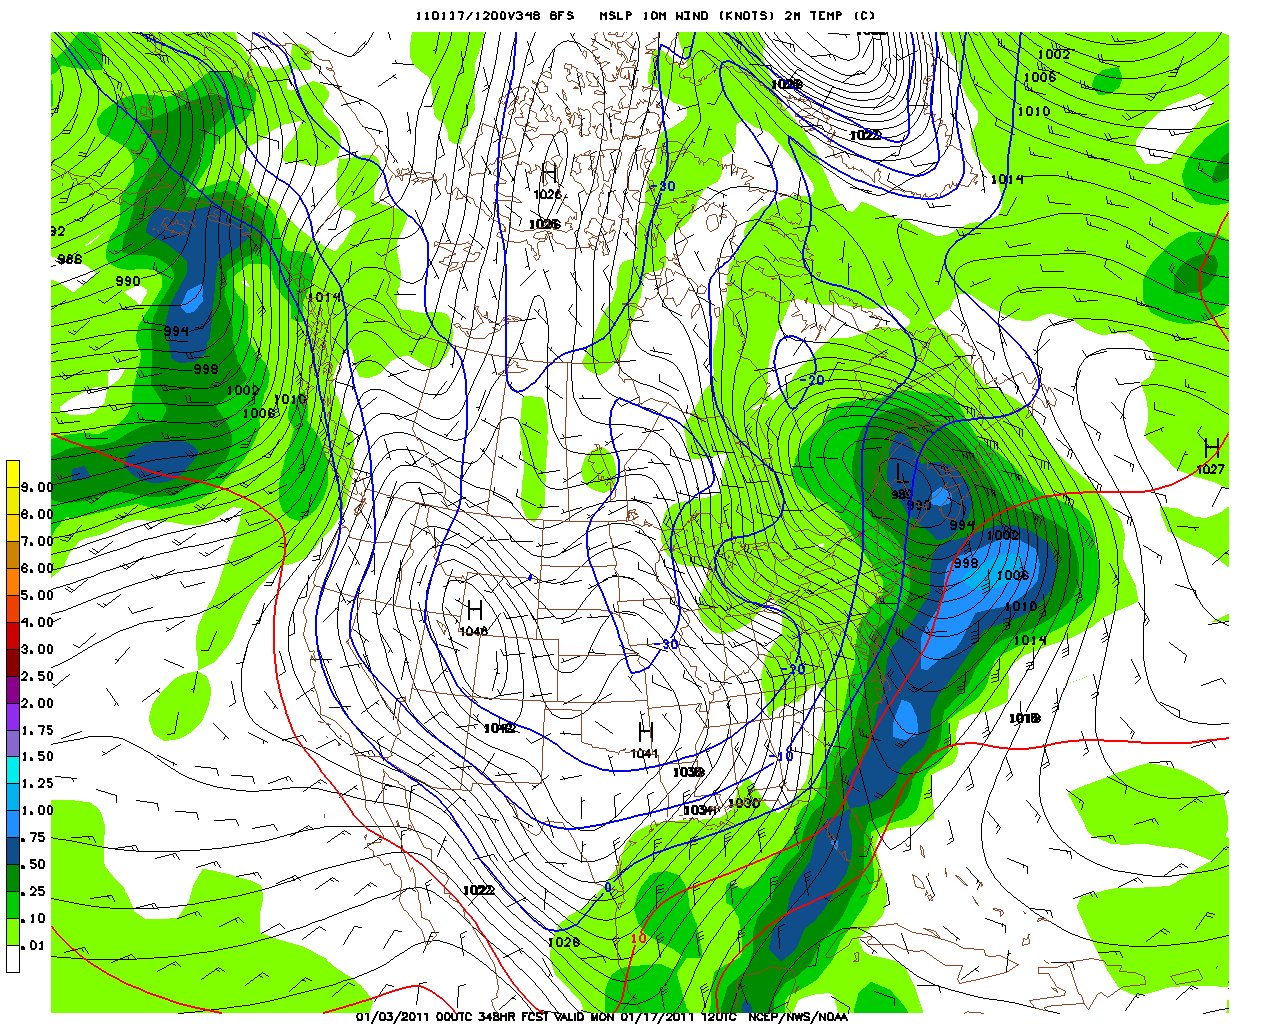
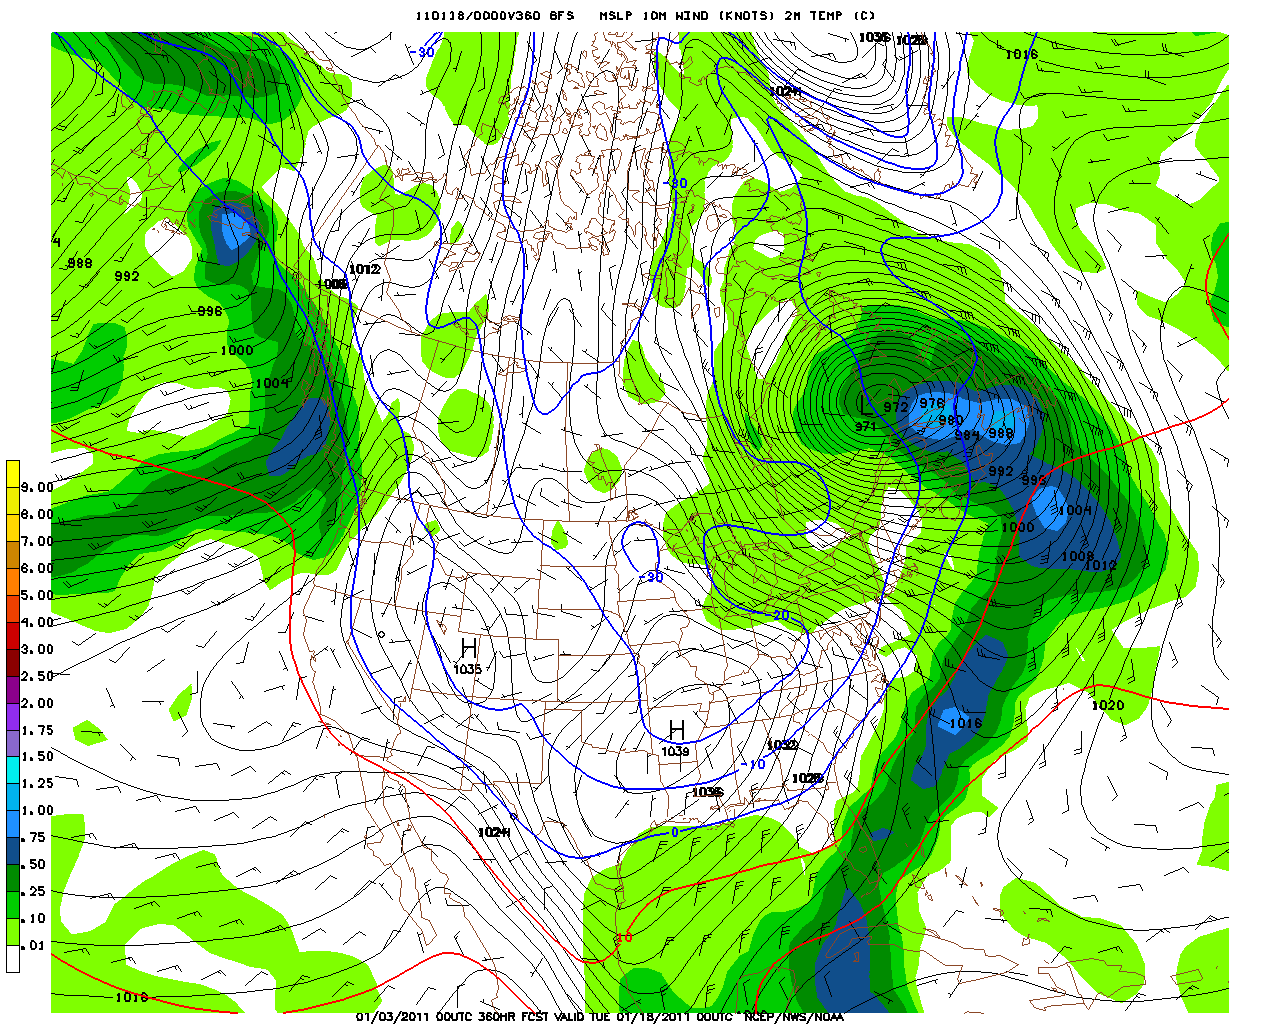
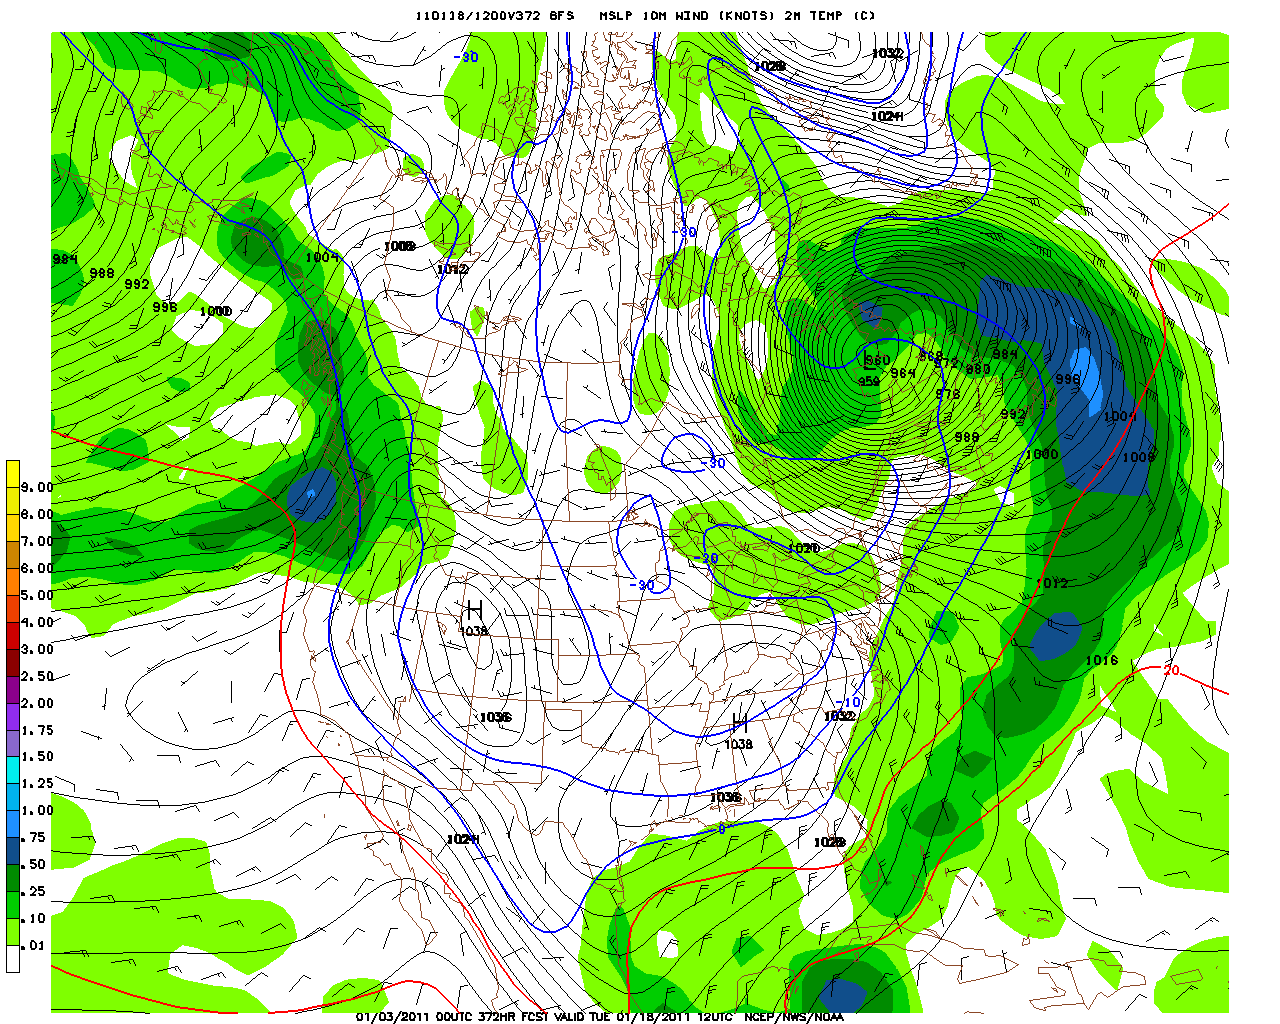
Both the ECMWF and GFS are signaling a major cold air outbreak of the likes we haven’t seen in years. Forecast temperatures from the GFS keep the central and southern plains below 0C (32F) for well over a week. Additionally, the GFS forecast from Sunday evening (00 UTC Monday) for the Martin Luther King, Jr holiday weekend has daily minimum temperatures of -20C (-4F) or below as far south as northern Texas and northern Louisiana. (Although, admittedly, the 12 UTC run was slightly warmer.) Also, as the next sequence of images shows, portions of Arkansas are not forecast to have daily maximum temperatures above -4F!
Surface (2-meter) temperatures valid Monday, 17 January 2011, at 6 AM CST
Surface (2-meter) temperatures valid Monday, 17 January 2011, at 6 PM CST
Surface (2-meter) temperatures valid Tuesday, 18 January 2011, at 6 AM CST
After seeing the 00 UTC GFS, I was curious about the frequency of such cold periods. I examined the daily temperature and precipitation records for KOKC dating back to 1 January 1948, to determine the number of times KOKC has recorded a minimum temperature of 0F or less. I then repeated this exercise to determine the times in which the daily maximum temperature was less than or equal to 10F. Since 1948, OKC has recorded a minimum temperature of 0F or less 31 times and a maximum temperature of 10F or less 7 times.
Broken down by decades:
[Decade: # of mins, # of maxes]
1950s: 3, 0
1960s: 5, 0
1970s: 8, 1
1980s: 13, 5
1990s: 2, 1
2000s: 0, 0
As you can see, the 1990s and 2000s had fewer of each than did the 70s and 80s. This leads me to a point that Harold Brooks brought up earlier today. The National Weather Service (NWS) updates its 30-year averages (normals) every 10 years, in contrast to World Meteorological Organization (WMO) standards of updating them every 30 years. This means that 2011 is the first year that NWS, and specifically the CPC, should be using the “new normals”. Thus, if CPC is using the “new normals”, what impact does this have on the Temperature Outlook above? Simply looking at the extremes listed above, replacing the 1970s with the 2000s in any 30-year average calculation would result in a warmer average. Thus, it would be (theoretically) easier to have a Temperature Outlook where the entire CONUS has a 33% or greater chance of below normal temperatures this year than last year. (Note, the next 30-year average update for WMO will be in either 2020 or 2021).
A word of caution here, *I do not know what the actual time range of the 30-year averages are in the CPC forecast above.** However, assuming that a contiguous 30-year period is used in the averaging, and we’ve replaced at least one of the 1960s, 1970s, 1980s, with the 1990s or 2000s, then the argument I’ve laid forth is still valid, regardless of the actual years used. *
So, readers, my questions to you:
- When was the last time Little Rock (KLIT) or Memphis (KMEM) recorded a daily minimum temperature below 0F?
- When was the last time they recorded a daily maximum temperature less than 10F?
- Since 1950, has either site recorded a day where the temperature failed to warm to greater than 0F?
Leave your answers in the comments! The answers will be posted on Friday!
And as promised, below are the data for the OKC Minimum/Maximum statistics mentioned in the article.
Daily Minimums of 0F or less for KOKC:
[Date: Minimum (Observed Snow Depth)]
- 01 Feb 1951: -1 (1.0)
- 04 Jan 1959: -4 (2.0)
- 05 Jan 1959: -2 (1.0)
- 11 Jan 1962: -1 (0.0)
- 12 Jan 1963: -3 (0.0)
- 13 Jan 1963: -1 (0.0)
- 23 Jan 1963: -1 (0.0)
- 24 Jan 1963: -1 (0.0)
- 09 Jan 1973: 0 (5.0)
- 12 Jan 1973: -1 (5.0)
- 09 Jan 1977: -2 (3.0)
- 10 Jan 1977: -3 (3.0)
- 18 Feb 1978: -1 (3.0)
- 08 Jan 1979: 0 (2.0)
- 31 Jan 1979: -1 (2.0)
- 09 Feb 1979: -3 (5.0)
- 11 Feb 1981: 0 (0.0)
- 10 Jan 1982: 0 (0.0)
- 11 Jan 1982: 0 (0.0)
- 21 Dec 1983: -2 (1.0)
- 22 Dec 1983: -3 (1.0)
- 24 Dec 1983: 0 (1.0)
- 25 Dec 1983: -1 (0.0)
- 19 Jan 1984: -3 (2.0)
- 08 Jan 1988: -4 (12.0)
- 03 Feb 1989: 0 (0.0)
- 21 Dec 1989: 0 (0.0)
- 22 Dec 1989: -4 (0.0)
- 23 Dec 1989: -8 (0.0)
- 03 Feb 1996: 0 (0.0)
- 04 Feb 1996: -3 (0.0)
Daily Maximums of 0F or less for KOKC:
[Date: Maximum (Observed Snow Depth)]
- 09 Jan 1977: 9 (3.0)
- 19 Dec 1983: 9 (0.0)
- 22 Dec 1983: 9 (1.0)
- 23 Dec 1983: 10 (1.0)
- 24 Dec 1983: 3 (1.0)
- 22 Dec 1989: 4 (0.0)
- 22 Dec 1990: 6 (2.0)


